Algoma Public Health


Local COVID-19 Data


Effective June 3, 2024, updates to this page will be paused until further notice. The Ministry’s COVID-19 surveillance is currently in transition to a new reporting system. In the interim please visit the Ontario Respiratory Virus Tool for provincial updates or Health Canada’s COVID-19 epidemiology update: Summary page for national updates.
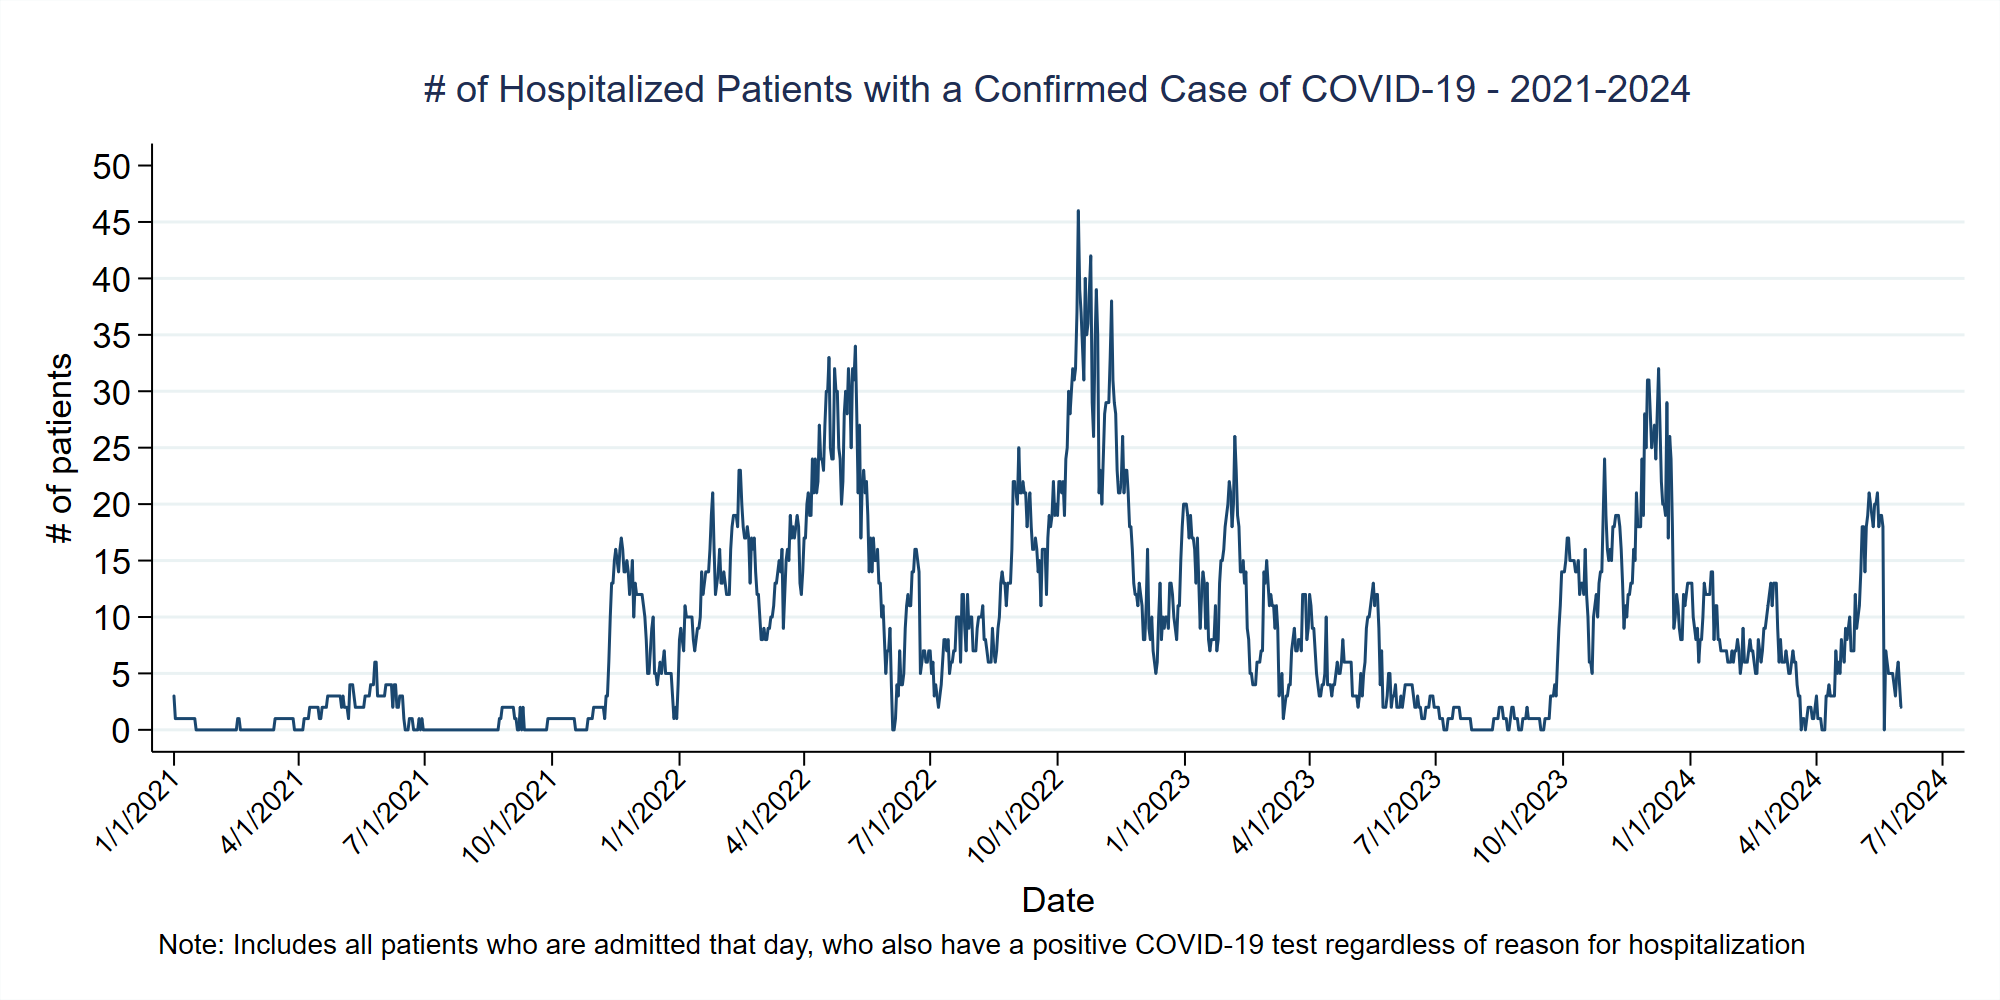
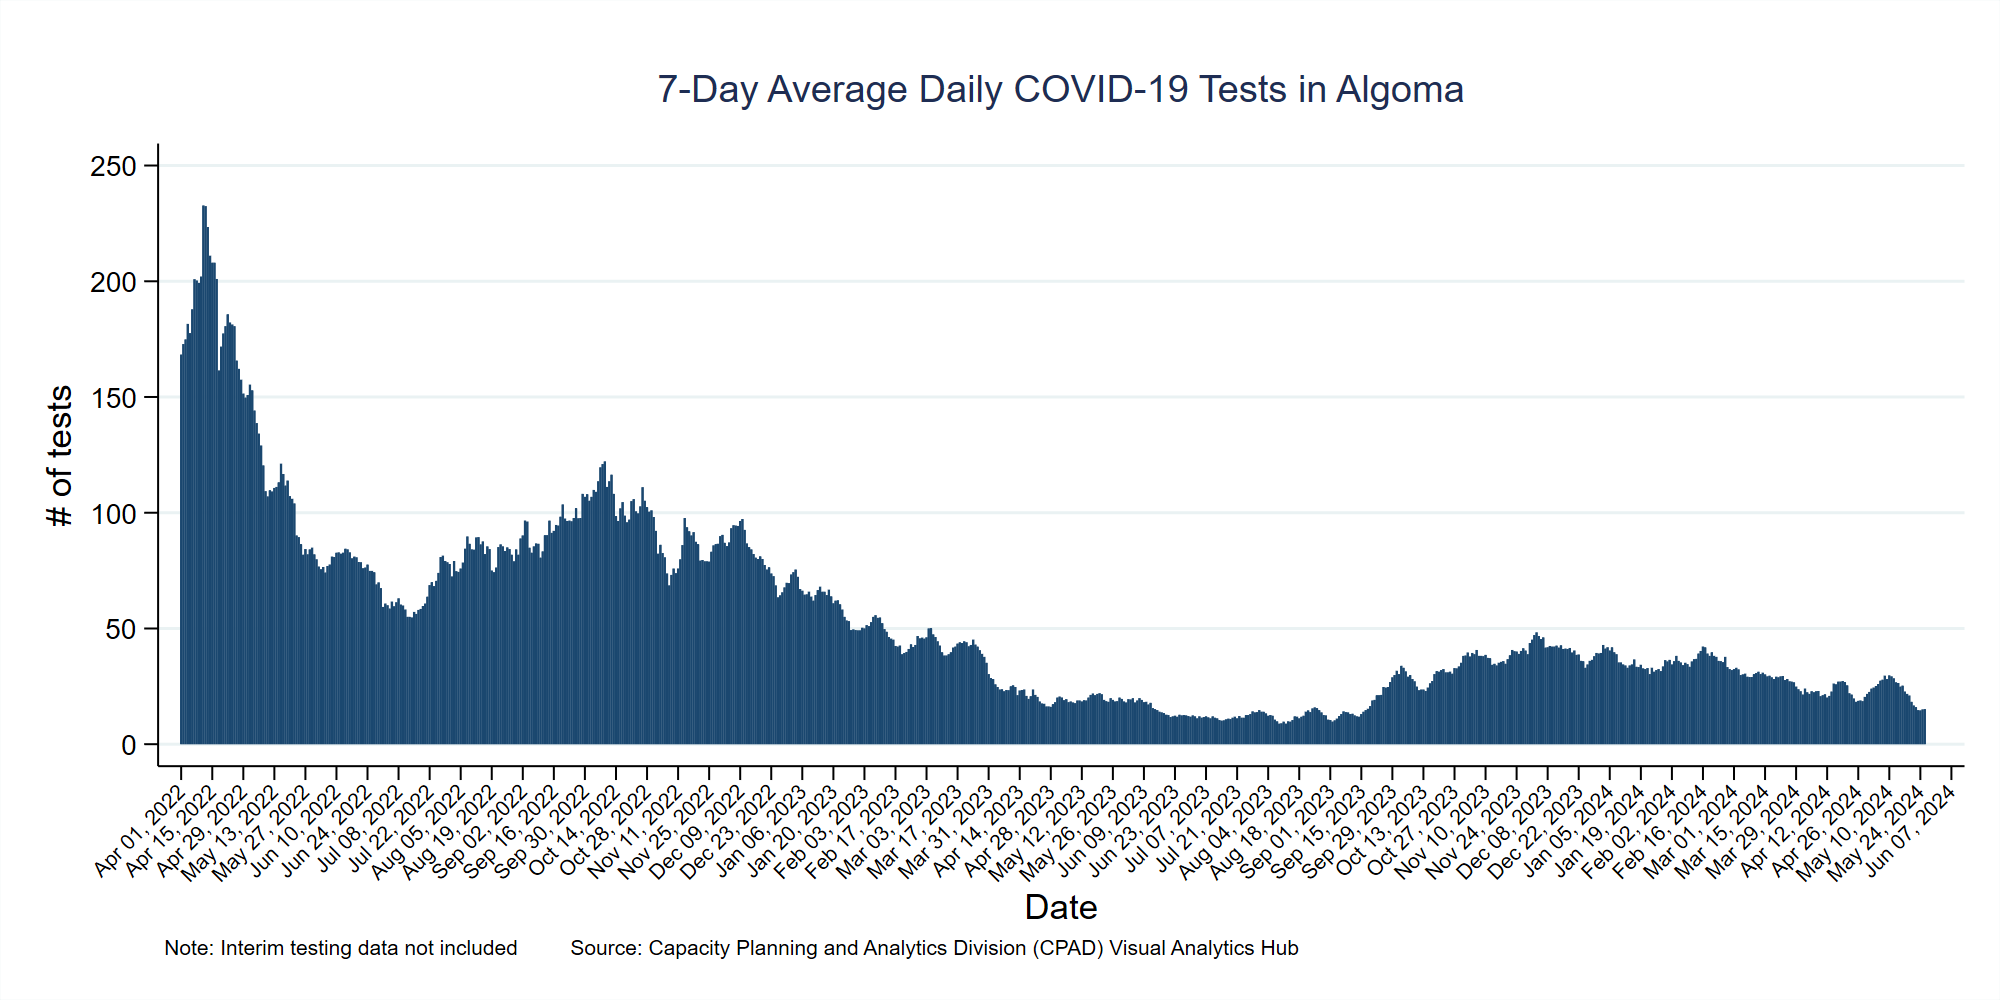
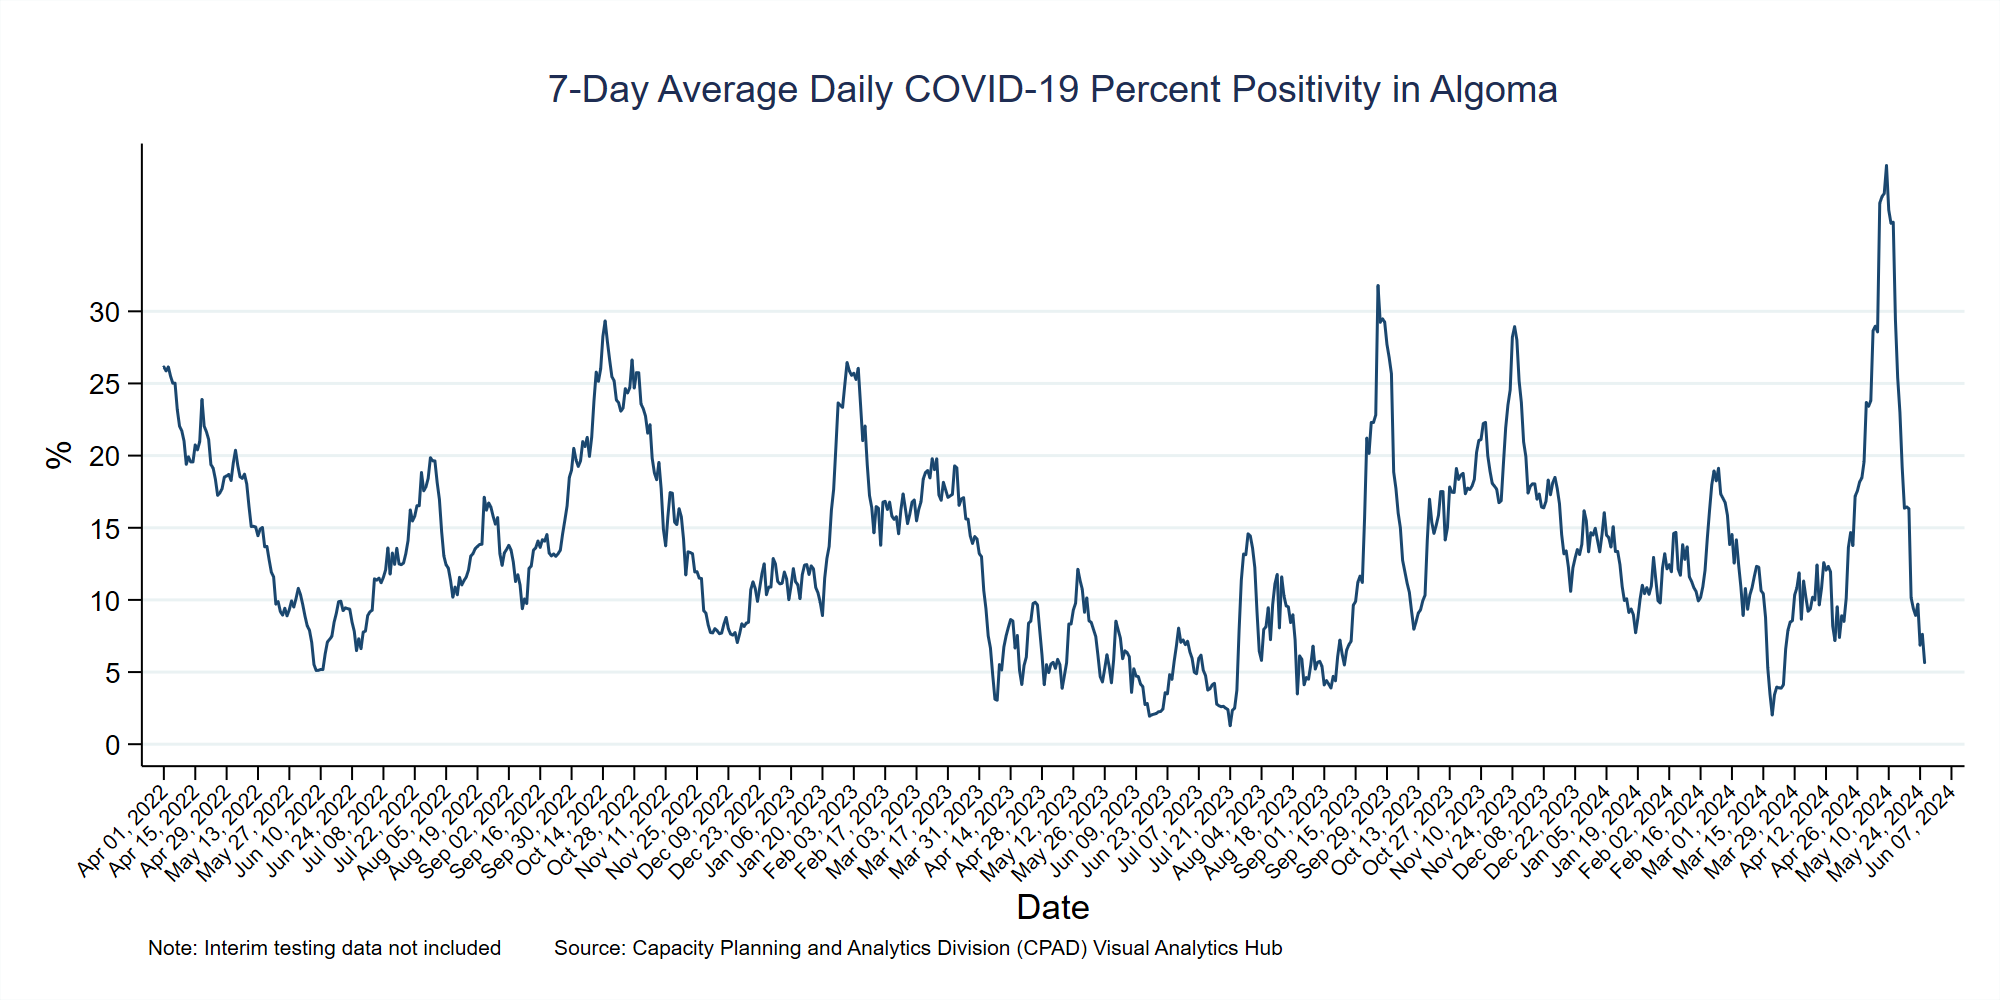
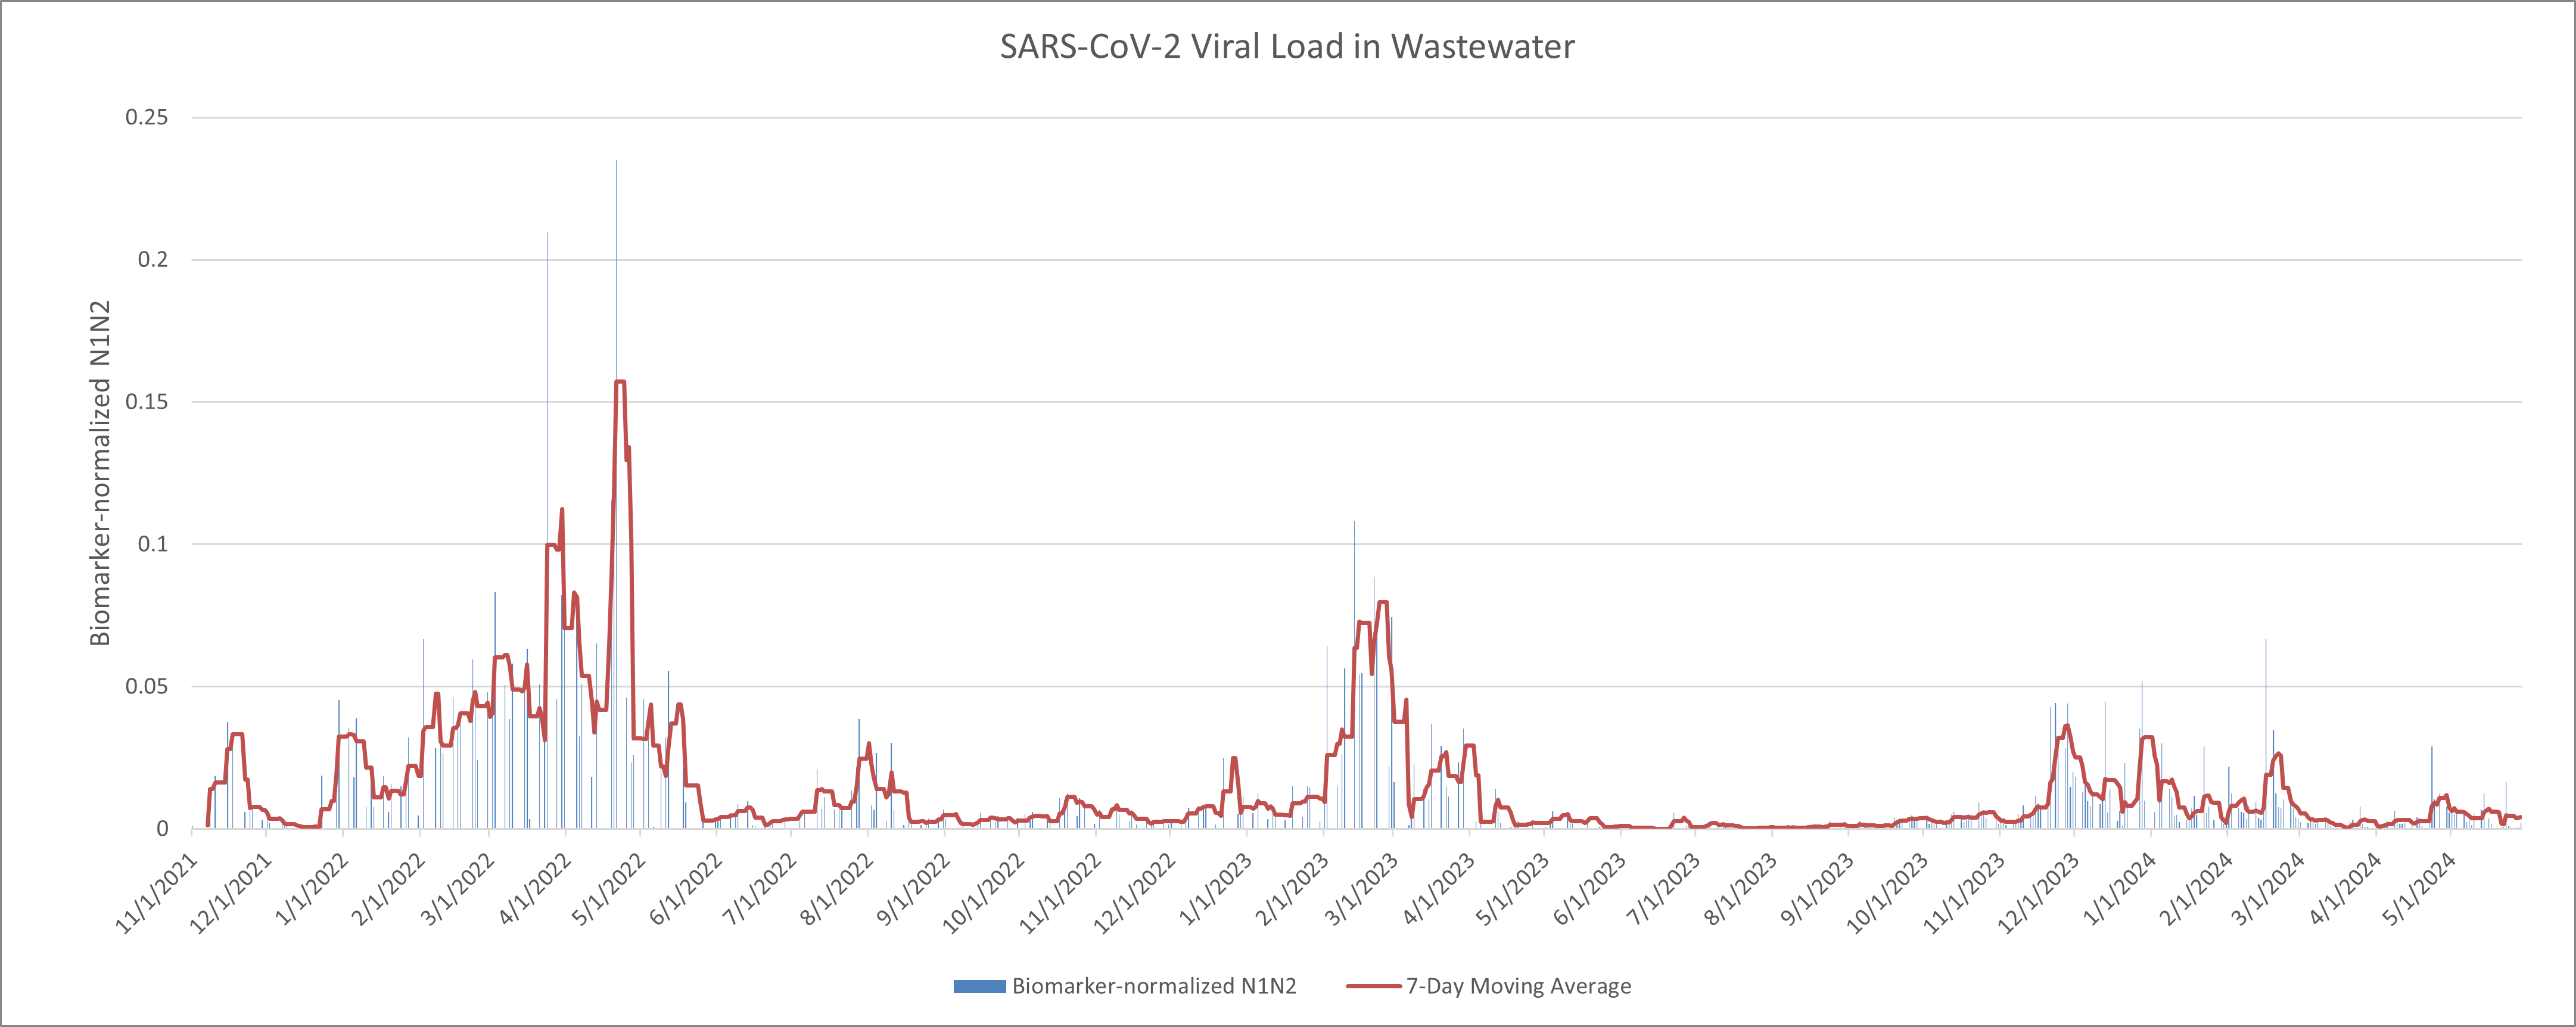
Confirmed COVID-19 Cases in Algoma
Updates to this page have been paused. Data displayed is reflective up to June 3, 2024.
| Current | Change in previous 7 days | |
|
Confirmed Cases |
14,201 | 19 |
|
Active Cases |
15 | -19 |
|
Resolved Cases |
14,186 | 38 |
|
*Rate of Cases per Week (cases per 100,000 population) |
11.5 | |
*only includes confirmed cases up to June 1, 2024
Confirmed COVID-19 Deaths in Algoma
Updates to this page have been paused. Data displayed is reflective up to June 3, 2024.
| Current Status | Previous status (7 days prior) |
Change from previous report | |
|
Deceased |
123 | 123 | No change |
|
COVID-19 was underlying cause of death |
65 | 65 | No change |
|
COVID-19 contributed to but was not underlying cause of death |
56 | 56 | No change |
|
Unknown cause of death |
2 | 2 | No change |
| Updated: June 3, 2024, 1:25 PM | |||
Cases by Area of Residence
Updates to this page have been paused. Data displayed is reflective up to June 3, 2024.
|
Algoma Region |
Current | Change in the previous 7 days |
|
Central & East Algoma |
1,739 | 7 |
| Elliot Lake & Area | 1,212 | 3 |
| North Algoma | 393 | 1 |
| Sault Ste. Marie & Area | 10,857 | 8 |
| Updated: June 3, 2024, 1:25 PM | ||
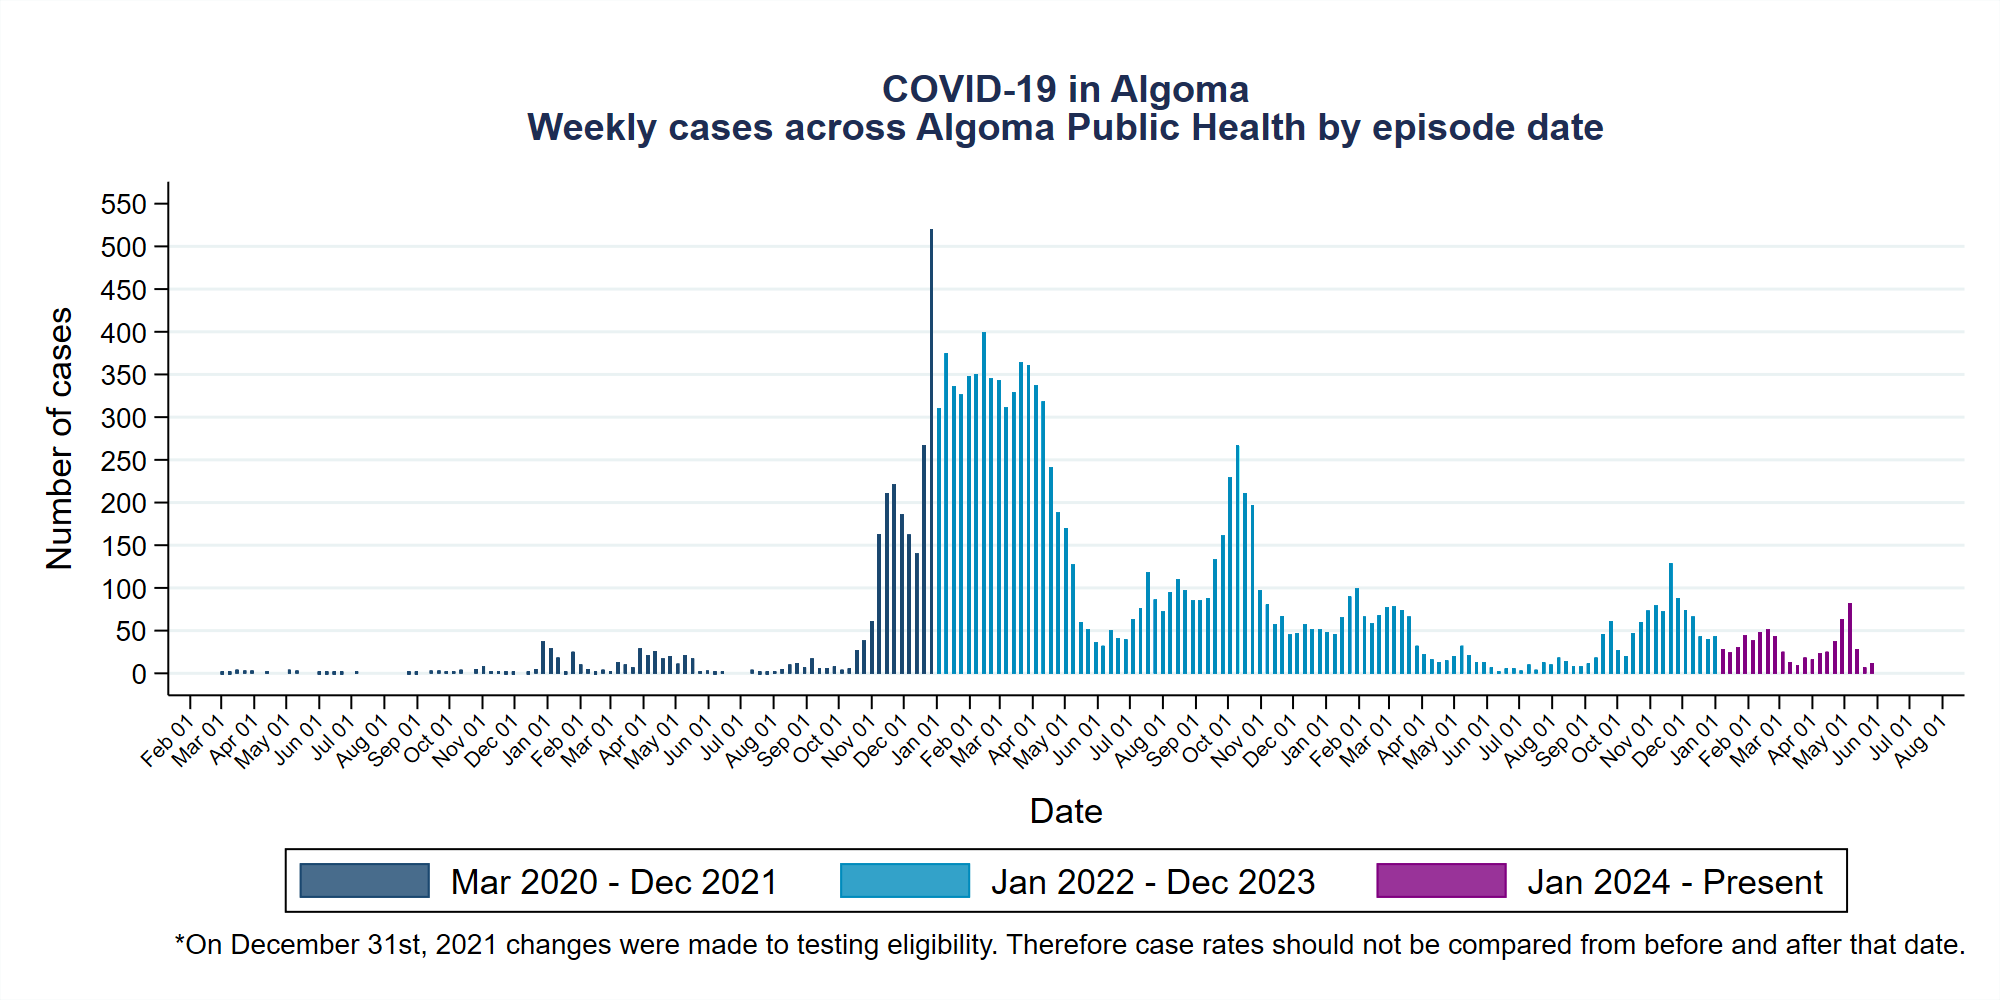
Weekly Case Count
Updates to this page have been paused. Data displayed is reflective up to June 3, 2024.
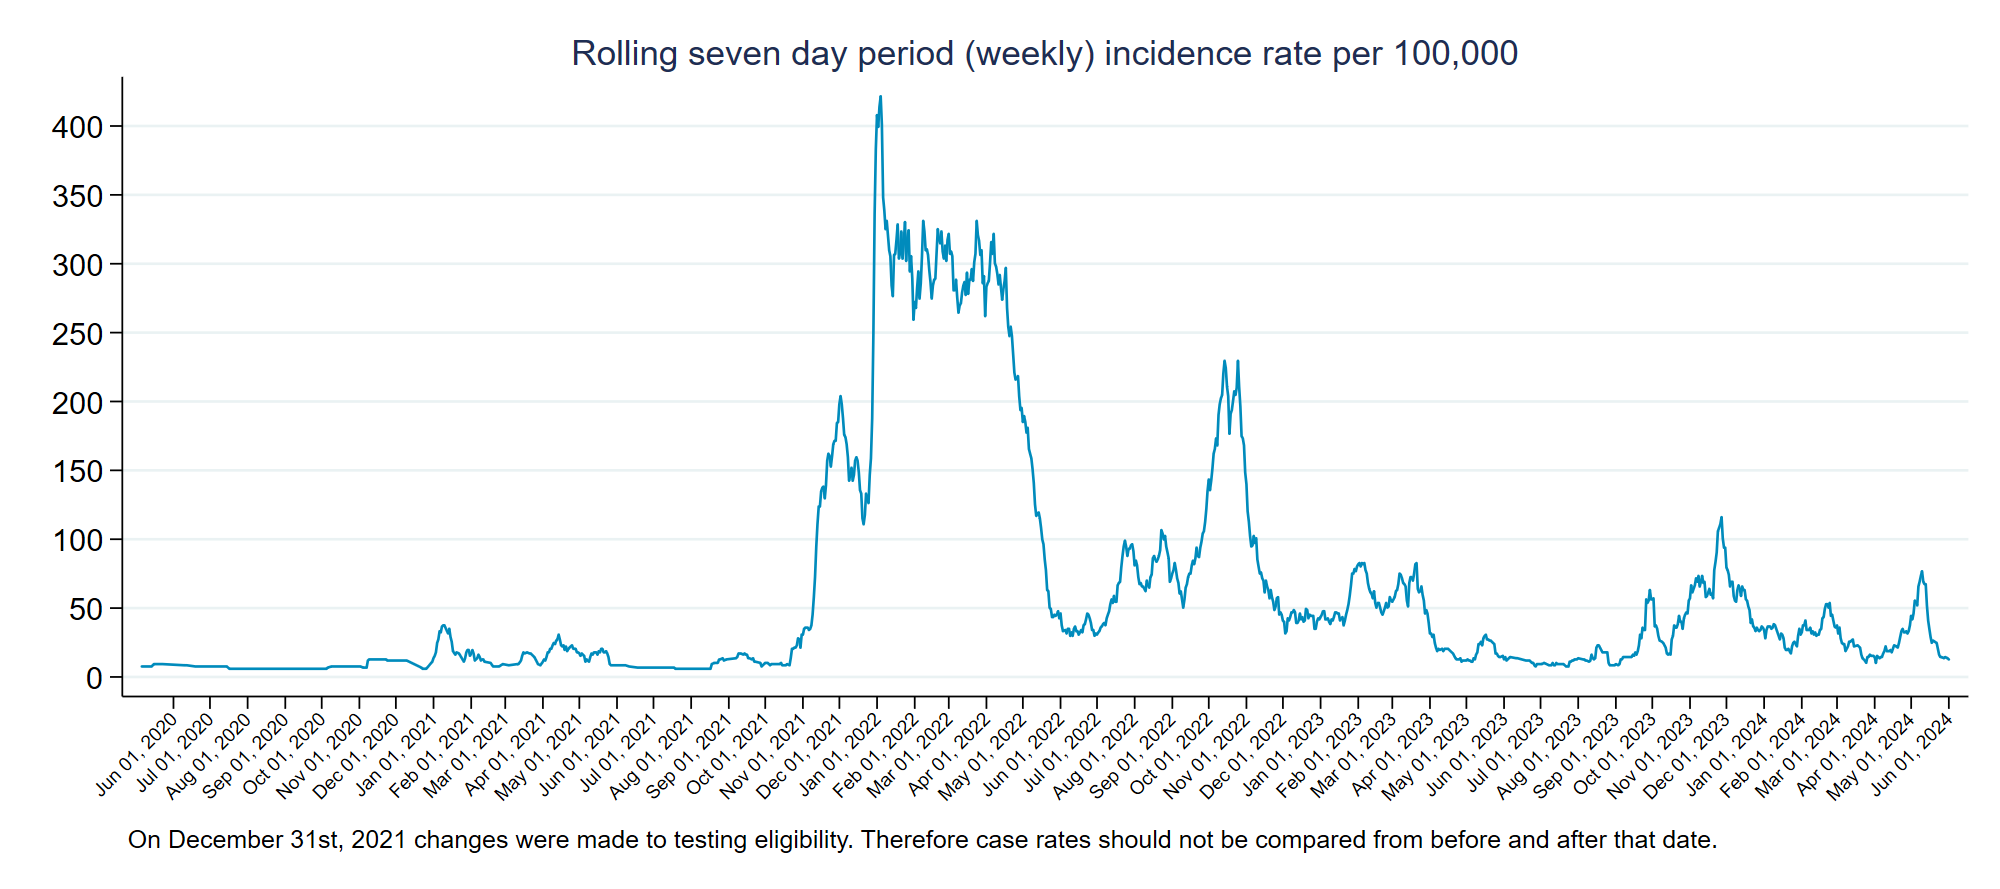
Weekly Incidence
Updates to this page have been paused. Data displayed is reflective up to June 3, 2024.
Outbreak Activity
Complete list of outbreak activity in Algoma.